
Research Paper
Health Impacts of Unlimited Access to Networked Transportation in Older Adults
Authors
Leslie Saxon, MD1*, Rebecca Ebert1, and Mona Sobhani, PhD1
Author affiliations
1 USC Center for Body Computing, Keck School of Medicine, University of Southern California, Los Angeles, CA, USA
Correspondence to: Leslie Saxon saxon@usc.edu
ABSTRACT
Background
Transportation barriers in older adults with chronic disease can lead to adverse outcomes like inability to access care and social isolation. Networked transportation can potentially meet this need and impact overall health. However, the lack of familiarity with services and limited use amongst older adults pose potential barriers to adoption.
Methods
The impact of networked transportation on overall health was studied by offering three months of free and unlimited Lyft, Inc. (San Francisco, CA) rides to patients aged 60 years or older with chronic disease and self-reported transportation barriers. Upon enrollment, subjects were provided personalized training on the networked transportation, surveys, and activity trackers (Fitbit, Inc., San Francisco, CA).
Results
Of the 150 subjects, 93% utilized Lyft with 86% using the mobile application (app). The mean number of rides was 69±65 with significantly more rides ordered through the app compared to calling-in (76±67 vs. 24±19, p<.05). Medical appointments accounted for 12% of destinations with remaining rides used for errands, entertainment, social visits, and fitness classes. Daily step counts did not increase with ride use (average steps: 2619±2796 versus 3614±3470, p>.05). Improved quality-of-daily-living was reported in 90% of subjects and 66% reported increased social visits. Upon study completion, 80% of subjects reported they would continue to utilize networked transportation although cost was a main deterrent.
Conclusions
Older adults with chronic disease taught to use networked transportation report less social isolation and increased quality of life. Future studies should utilize economic modeling to assess cost-benefits of networked transportation for older adults.
KEYWORDS: networked transportation, Lyft, Uber, ridesharing, older people, technology
INTRODUCTION
Persistent transportation limitations prevent older adults with chronic disease from receiving necessary medical care and access to other resources essential to overall health, such as fitness activities and social engagement.[1–4] This is a critical problem for older adults as the lack of medical access and activity, as well as social isolation, are known predictors of adverse health outcomes.[5] One-fifth of older adults, and even more for those with chronic disease or socioeconomic disparities, do not drive and as many as one-third of those who do drive face driving restrictions.[4,6] This population is reliant on family members or caregivers, public transportation, or existing government-sponsored ride programs, which are costly, inefficient, and are too often ineffective.[7–9] While previous studies have begun to examine the impact of transportation barriers on medical access, these study designs have been limited in that they have not focused on older adults, technology adoption, or additional aspects of health.[10] Amongst a flood of digital technology solutions, networked transportation is empowering many people while disrupting the current paradigm of transportation.[11] Networked transportation has the potential to meet the transportation need of older adults and impact overall health, yet the low adoption rates due to lack of familiarity with the service or software in this rapidly growing population pose a potential barrier.[12–14] This novel research study investigates a possible solution for this high impact problem and explores the wide influence of transportation on multiple aspects of health in an older population.
METHODS
Three-months of free and unlimited networked transportation (Lyft, Inc., San Francisco) were offered to Keck Medicine of USC patients in order to study the impact of networked transportation on the overall health of older adults with chronic disease, including transportation adoption through analysis of ride frequency and destinations, access to medical care, social engagement, activity levels, and quality-of-daily-life. Subjects were eligible if they had chronic disease, were 60 years or older, were English speakers (due to third-party language restrictions), had self-reported transportation barriers (widely defined as financial issues, parking issues, car trouble, traffic stress, social burden of asking friends or family, etc.), had the ability to self-transport in and out of a vehicle, and whom resided in Los Angeles County or one of the five surrounding counties (Ventura, Kern, Riverside, San Bernardino, and Orange Counties).
All subjects were provided with personalized training on the use of the mobile application (app) or for those without access to a smartphone were provided with a call-in service for accessing rides. Regardless of ride-access, all subjects’ activity levels were recorded via provided wrist-worn wearable activity monitors (Fitbit, Inc, San Francisco, Ca) over a two-week interval following enrollment and also throughout the three-month ride-access study interval. At enrollment and upon study completion, questionnaires were administered including demographic, transportation and technology use, as well as subjective and objective psychological and social factors, such as Satisfaction with Life, Geriatric Depression, and Social Support.[15–17] The Satisfaction with Life scale contained statements such as, “the conditions of my life are excellent” and “if I could live my life over, I would change almost nothing”, while the Geriatric Depression Scale asked questions such as “do you feel full of energy? and “do you feel that your situation is hopeless?”
Statistical analyses were performed using R Statistical Software.[18] Percentages were calculated for the type of rides taken. Descriptive statistics and percentages were calculated for all demographics, pre- and post- study surveys, as well as the number of rides taken, cost of rides, and daily step count. Welch T-Tests were used to assess differences between app users and call-in users on age and number of rides.[19] A chi-square test of goodness-of-fit.[20] was performed to assess whether there were differences between app users and call-in users on gender frequencies, living arrangements, education levels, income, and employment. To examine whether there was a difference between the number of daily steps taken during the baseline and ride-access study period, a paired t-test was performed. Paired t-tests were also used to compare pre- and post-study validated measures of Satisfaction with Life and Geriatric Depression.[21] To examine whether the number of rides taken were associated with Social Support, Satisfaction with Life, or Geriatric Depression, correlations were run.
RESULTS
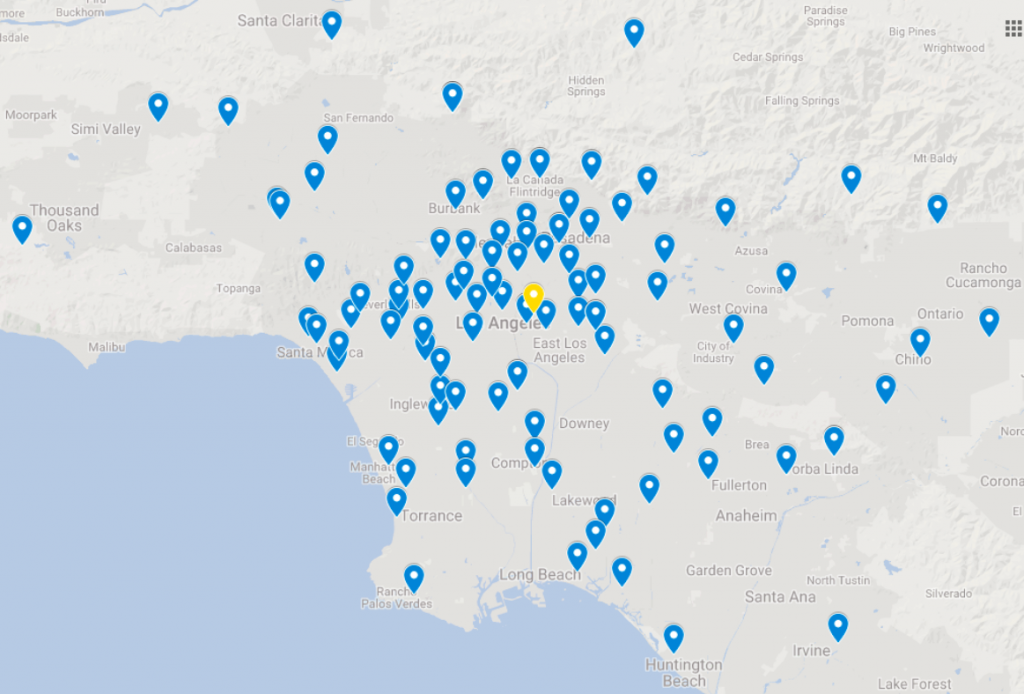
The study sample included 150 subjects (mean age 72±8 years, range 60-94 years; 63% female; 54% Caucasian; >45% relied on others for transportation needs; 40% lived alone; 47% annual income <$50,000, 96% high school diploma). Subjects resided all over the six-county catchment, as seen in Figure 1; the average distance from subjects’ residences to Keck Medical Center was 20 miles. A majority of subjects reported having heard of networked transportation prior to study enrollment, but few had used the services on a regular basis, citing cost, unfamiliarity, and discomfort as reasons for disuse. Of the entire cohort, 93% of subjects participated in the study by ordering Lyft rides. At enrollment, subjects reported that the most frequently used mobile phone services were email and web browsing.
Figure 1. Map of Keck Medical Center (in yellow) and subjects’ zip codes (in blue).

A majority of subjects (86%) opted to use the mobile app to order rides, with the remainder of subjects using the call-in service (16%). The mean number of rides per subject was 69±65 (range 4-346, mean cost per subject/month $500). Significantly more rides were taken by app users compared to call-in users (76±67 vs. 24±19). Mobile app users were also significantly younger on average (71±7 vs. 79±9), but there were no differences between user types on gender frequencies, living arrangements, education levels, income, or employment. The average cost of a ride was $21.72±$19.33. Medical appointments accounted for nearly one-third of all destinations and the remaining rides were used for errands, to access entertainment and other leisure activities that included social visits and fitness classes. The majority of subjects reported using networked transportation as their primary transportation to medical visits and social visits. Over 80% of subjects reported that they would continue to utilize the transportation, the remainder reported that the main deterrent to continued use was cost.
At baseline subjects were relatively sedentary (walking about one mile per day) and access to networked transportation did not significantly increase activity as measured by step count. Daily step counts did not increase significantly from the baseline to the ride-access study period (mean daily steps 2619±2796 versus 3614±3470).
On the post-study survey, subjects reported improved quality-of-daily-life with access to unlimited rides (92%). At baseline, for the Satisfaction with Life Scale and the Geriatric Depression Scale, the study cohort matched population normative averages for the age range.15,16 There were no significant differences between pre- and post- study validated measures of Satisfaction with Life and Geriatric Depression. The number of rides taken was significantly negatively correlated with self-reported Social Support, but not with Satisfaction with Life or Geriatric Depression. Forty-seven subjects (31%) were lost-to-follow-up due to homelessness, cognitive decline, death, hospice, prolonged hospitalization, or unknown reasons and thus did not complete post-study surveys.
DISCUSSION
The study results show high adoption of networked transportation by an older population with chronic disease, and as a result of the transportation, easier access to health care, increased social engagement, and improved subjective quality-of-daily-life. These results confirm that patients had the health resources available, i.e. established medical care and socializing opportunities, yet transportation was a significant barrier to accessibility.
A significant majority of subjects opted for and actively used the app version (about one ride a day) of the transportation, despite subjects being novice app users and having reported that before the study the main use of their smartphones was geared toward email and web browsing. This is a hugely important finding exemplifying that older populations are willing and capable of adopting new technologies, contrary to previous reports that showed low adoption of networked transportation. One possible explanation for the high adoption in our study was the deeply personalized and engaging pre-study educational training on the app technology, and the continued technology support throughout the study that left subjects reporting on the ease of use of the app and service.
Subjects used the networked transportation for a variety of outings, including medical appointments, entertainment, social visits, and fitness activities. Although there were no significant differences found between pre- and post-validated survey responses for Satisfaction with Life and Geriatric Depression, subjects reported very significant improvements in access to care, social engagement and general quality-of-daily-life with adoption of networked transportation solutions for older adults. One possible explanation for these findings are that while transportation remains a crucial aspect to overall health in this population, additional factors associated with chronic disease and socioeconomic status, such as food insecurity and lack of housing stability, remain essential and potentially lacking.[22,23] It is also feasible that the measures were not the best tools to capture the differences and thus perhaps new and more nuanced surveys are required to appropriately measure these effects in this study population. It may be possible that to see significant effects on deeply established psychological and sociological factors, a study duration of greater than three months is required. Future studies should focus on the long-term effects of reduced transportation barriers by examining a longer study duration.
Daily step counts did not significantly differ between the baseline period and the ride-access study period. This may be due to the fact that having ride access meant subjects were taking transportation more and walking less to certain destinations. Future studies should employ different measures of activity, such as self-report of fitness activities and locations, to supplement step count from activity trackers, as they may be more meaningful measures of activity. These results also indicate that this cohort was a chronically ill population, e.g. undergoing treatments for cancer, and thus activity could be limited, which underscores the vulnerability of this sedentary population.
Subjects who reported feeling more socially-supported took fewer rides, which may mean that people who are socially supported require less rides due to transportation that is available to them from their support network. This again highlights the value and importance of networked transportation, or more broadly transportation, in helping to relieve social isolation, which is one of the biggest predictors of adverse health outcomes.
This study design was unique and novel in that study staff were able to deeply understand the complicated ways in which transportation is a barrier to older adults, a concept that can be difficult to quantify. From the multitude of stories our research staff encountered that included somber tales of older adults taking multiple busses, relying on busy family members that live far away, or waiting several hours for van transport are memorable and disconcerting. The fact emerged that transportation transcends simple relocation from point-A-to-point-B and encompasses multiple human facets of life, e.g. physical and emotional discomfort. Anecdotal reports from subjects were overwhelmingly positive; upon study completion one subject wrote, “I am so happy to have learned how to use Lyft. It makes me feel safe and in control and gives me new travel and socializing options and freedom.” Research staff were able to experience the stories of study subjects and in doing so observe the unique ways in which networked transportation caters to the complicated needs of older adults (Figure 2). These stories highlight the complicated nature of how transportation barriers restrict the overall life of an older adult. When this simple barrier is removed, these adults show improved metrics in essential aspects of health, such as access to medical care, social engagement, and improved quality-of-daily-life.
Figure 2. Patient Vignettes
![]()

![]()
![]()
![]()
![]()
![]()
Transitioning from the free access to networked transportation, the majority of subjects reported that the largest barrier to continuing to use the networked transportation, after study conclusion, was cost. In order to leverage the value of the resources available through private companies, this pilot study should be replicated to include an economic model that can accurately measure the cost-benefits of providing networked transportation to older adults. Additionally, the often-overlooked secondary cost of family members or friends taking off from work, as well as other paid or unpaid duties to provide transportation, have not been well quantified with similar models. Programs offering affordable networked transportation to older adults is beginning to be implemented on a small scale, such as Santa Monica’s Mobility On-Demand Everyday (MODE) program in Southern California offering Lyft rides within city limits for $0.50 per ride to older adults, however these programs need to be enacted on a national or even global scale.[24] The data from this study should incentivize insurance payers and innovation programs to introduce similar large-scale programs. Covering rides for older adults could not only improve hard outcomes, such as rates of hospitalization, but also improve overall health as demonstrated in this study.
KEY TAKEAWAYS
- Older adults adopt and use networked transportation to access medical care, as well as fitness, social, and leisure activities, thus improving their perceived quality-of-daily-life.
- Older adults are motivated to break down the barriers disrupting their own health and are willing and are even enthusiastic about adopting novel technology solutions in order to do so, but education and support remain key elements in rates of success.
- Cost was the primary deterrent preventing older adults from continued use of networked transportation following study completion.
REFERENCES
- Ritter AS, Straight A, Evans E. Understanding Senior Transportation: Report and Analysis of a Survey O… Washington, DC; 2002. https://www.aarp.org/home-garden/livable-communities/info-2002/aresearch-import-743-2002-04.html.
- Syed ST, Gerber BS, Sharp LK. Traveling Towards Disease: Transportation Barriers to Health Care Access. J Community Health. 2013;38(5):976-993. doi:10.1007/s10900-013-9681-1
- Loukaitou-Sideris A, Bronzen M, Levy-Storms L, Wachs M. UCLA Luskin | Transportation and Isolation: Serious Challenges for Diverse, Older Angelenos | UCLA Luskin.; 2018. https://luskin.ucla.edu/transportation-and-isolation-serious-challenges-for-diverse-older-angelenos/.
- Ryvicker M, Bollens-Lund E, Ornstein KA. Driving Status and Transportation Disadvantage Among Medicare Beneficiaries. J Appl Gerontol. October 2018:073346481880683. doi:10.1177/0733464818806834
- David Frank. Social Isolation: Symptoms, Prevention, Treatments. 2018. https://www.aarp.org/health/conditions-treatments/info-2018/social-isolation-symptoms-danger.html.
- Loughran D, Seabury S, Zakaras L. What Risks Do Older Drivers Pose to Traffic Safety? RAND Corporation; 2007. doi:10.7249/RB9272
- De Nardi M, French E, Jones JB, McCauley J. Medical Spending of the US Elderly. Fisc Stud. 2016;37(3-4):717-747. doi:10.1111/j.1475-5890.2016.12106
- Office USGA. Nonemergency Medical Transportation: Updated Medicaid Guidance Could Help States. 2016;(GAO-16-238). https://www.gao.gov/products/GAO-16-238.
- Fitzpatrick AL, Powe NR, Cooper LS, Ives DG, Robbins JA. Barriers to health care access among the elderly and who perceives them. Am J Public Health. 2004;94(10):1788-1794. http://www.ncbi.nlm.nih.gov/pubmed/15451751.
- Chaiyachati KH, Hubbard RA, Yeager A, et al. Association of Rideshare-Based Transportation Services and Missed Primary Care Appointments. JAMA Intern Med. 2018;178(3):383. doi:10.1001/jamainternmed.2017.8336
- Gianni J Di. Exploration of the Current State and Directions of Dynamic Ridesharing. Theses, Diss Culminating Proj. August 2015. https://digitalcommons.montclair.edu/etd/187.
- Powers BW, Rinefort S, Jain SH. Nonemergency Medical Transportation. JAMA. 2016;316(9):921. doi:10.1001/jama.2016.9970
- Mather M. Fact Sheet: Aging in the United States – Population Reference Bureau. PRB. https://www.prb.org/aging-unitedstates-fact-sheet/. Published 2016.
- Anderson GO. 2016 Technology Trends Among Mid-Life and Older Americans. Washington, DC; 2016. doi:10.26419/res.00140.001
- Diener E, Emmons RA, Larsen RJ, Griffin S. The Satisfaction With Life Scale. J Pers Assess. 1985;49(1):71-75. doi:10.1207/s15327752jpa4901_13
- Yesavage JA, Brink TL, Rose TL, et al. Development and validation of a geriatric depression screening scale: A preliminary report. J Psychiatr Res. 1982;17(1):37-49. doi:10.1016/0022-3956(82)90033-4
- Koenig HG, Westlund RE, George LK, Hughes DC, Blazer DG, Hybels C. Abbreviating the Duke Social Support Index for Use in Chronically Ill Elderly Individuals. Psychosomatics. 1993;34(1):61-69. doi:10.1016/S0033-3182(93)71928-3
- R Core Team. R: A language and environment for statistical computing. 2013. http://www.r-project.org/.
- Welch BL. The Generalizatoin of ‘Student’s’ Problem when Several Different Population Varlances are Involved. Biometrika. 1947;34(1-2):28-35. doi:10.1093/biomet/34.1-2.28
- Pearson K. On the criterion that a given system of deviations from the probable in the case of a correlated system of variables is such that it can be reasonably supposed to have arisen from random sampling. London, Edinburgh, Dublin Philos Mag J Sci. 1900;50(302):157-175. doi:10.1080/14786440009463897
- Cohen J. Statistical Power Analysis for the Behavioral Sciences. Academic Press; 1977.
- Strickhouser S, Wright JD, Donley AM. Food Insecurity Among Older Adults: Full Report 2015. https://www.aarp.org/content/dam/aarp/aarp_foundation/2015-PDFs/AF-Food-Insecurity-2015Update-Final-Report.pdf.
- Findings on Financial Security for AAPI Seniors & Their Families: A Landscape Assessment & Community Survey Results. 2015. https://www.aarp.org/content/dam/aarp/home-and-family/asian-community/2016/09/capacd-report-aarp-2016.pdf.
- Mobility On-Demand Every Day Program – Big Blue Bus. https://www.bigbluebus.com/Rider-Info/Mobility-On-Demand-Every-Day-Program.aspx.
CONFLICTS OF INTEREST
The authors have no conflicts of interest to disclose.
DECLARATION OF SOURCES OF FUNDING
This work was supported by AARP Foundation (Washington, D.C.). No funding support was contributed by Lyft (San Francisco, Ca).
ETHICS COMMITTEE APPROVAL
The study was approved by the Institutional Review Board of the University of Southern California (USC IRB HS-17-00729).